Approximately 43% of the web analytics market share is held by GA4. This shows how important Google Analytics 4 is and how they have captured such a big market. Let’s see how you can grow your business today!
After the release of the AI overview, Google has shown some significant numbers. There is a huge search base for queries. What does this mean for you and your business? More visitors generally mean more customer prospects, interest, and significant success.
Well, yes, you can see more visitors, but the competition is increasing daily. What can you do? How should your business position itself in the market? How do you get more people to come, especially the right ones? The key lies in knowing your audience well– that is where Google Analytics 4 (GA4) steps in.
GA4 is an impressive tool for today’s day and age. It makes how individuals use your site and apps transparent. If you are using it correctly, there’s a higher possibility that you are making educated decisions that grow your audience. This tool is awe-inspiring. GA4 gives you insights into the groundwork for genuine, lasting growth.
This article will show you a thing or two you did not know about GA4. We will cover everything from how it helps bring in more visitors, how to get started, and how to produce reports that give you streamlined actions. Let’s see how you can maximize your site’s traffic today.
Why the Shift to GA4?
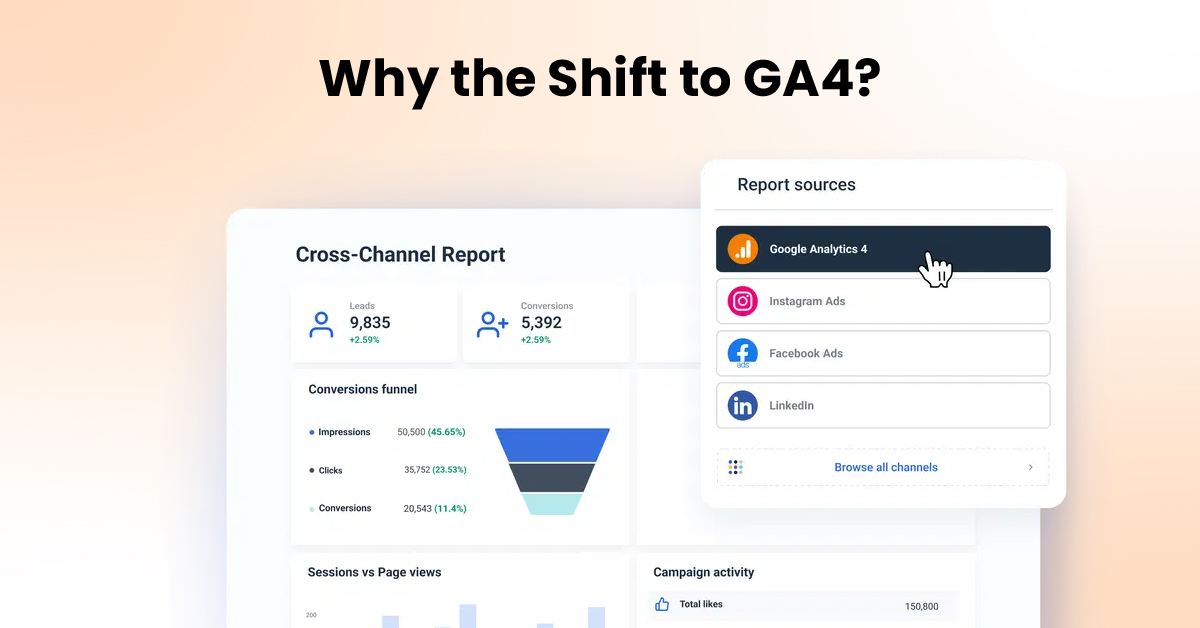
Most site owners were accustomed to Google’s earlier version, Universal Analytics (UA). So why the big transition to GA4? Google has changed, and so have other search engines. UA’s older version can’t keep up with the latest developments. Let’s see how GA4 performs:
Old Way (UA):
Measuring Visits: UA mostly measured web visits. If someone visited your site on his computer and mobile phone, UA would count him as two different people. That made it impossible to see the whole customer path. It made it unclear about the customer.
The New Approach (GA4):
Tracking Actions: GA4 tracks actions. These are things like viewing pages, clicking buttons, watching videos, downloading files, or buying products. Everything is tracked. This approach is much more nimble. It gives a better picture of what people do on your site, no matter how often they return. It connects what’s done on various visits and even on different devices.
Works Across Devices and Platforms:
People use phones, tablets, and laptops. They switch between sites and apps. GA4 is built to measure this cross-device, cross-platform behaviour more accurately. It gives you a single, easy-to-understand picture of your user across all their touchpoints.
Privacy Considerations:
New privacy laws and browser changes have made it harder to track. GA4 was designed following Article 15 of the General Data Protection Regulation (GDPR).
- It uses fewer cookies.
- It uses intelligent guessing to fill in missing data when users don’t opt for tracking.
- Also, it gives insight while preserving user privacy.
More brilliant Insights with AI:
GA4 uses Google’s intelligent learning machines. This adds predictions (like guessing whether a user will buy something) and automated insights. This allows you to see trends and opportunities that you’d likely miss.
In short, moving to GA4 was not an update. It was a change that was needed to give more precise, user-centric, private, and valuable information on how users use the internet nowadays. Understanding the “why” will give you an idea of how GA4 can help you grow.
How Google Analytics 4 Features Help Get More Visitors (The Way to Big Growth)
GA4 doesn’t magically get people to your website. Instead, it provides the information to improve your plans, bring in the right individuals, and have them return. Here’s how particular GA4 tools assist in growing traffic:
Understanding How Users Act:
What it is: Action tracking lets you see small things people do. See what buttons are pressed, how far users scroll, what videos they watch, etc. Engagement metrics (like the number of engaged’ visits) show whether your content keeps users engaged.
How it drives traffic: Knowing what people do allows you to refine your website’s design, user experience (UX), and content. Better UX keeps people hanging around longer and browsing more. This signals search engines like Google that your website is fine, improving your search ranking (SEO). Knowing what kind of content works allows you to produce more of what your visitors like. This brings them back and shares them.
Discover Your Best Content:
What it is: “Pages and Screens” reports show you which pages are most viewed and interesting. You can track content-related actions, such as PDF downloads or form submissions on certain pages.
How it drives traffic: Knowing which blog posts or landing pages work best enables you to write more about the best subjects. To push your best content harder (social media, email, ads). To link popular pages to other pages that you want users to see. This focused content approach attracts users searching for things you do well.
Making Traffic Sources More Effective:
What it is: The “Traffic Acquisition” report shows where your users are coming from (e.g., Google Search, Ads, Direct Visits, Social Media). It shows how many visitors there are and whether they are exemplary (how engaged they are, whether they buy).
How it makes traffic: This helps you spend your marketing time and money effectively: Spend more on sources that generate exemplary visitors. Look for sources that offer less interested traffic. Either optimize your strategy there or spend less. Look at traffic from other sites (links) to build relations with sites that send exemplary visitors. Optimize your SEO by looking at which searches send interested users (you need to link to Google Search Console). Focusing on tried sources gets you more traffic.
Creating Smarter User Groups:
What it is: GA4 lets you segment users into specific ‘audiences’. You can segment them by location, age, device, where they originated, and most importantly, what they do (users who looked at a specific page, clicked on a button, bought something, etc.).
How it grows traffic: These user groups benefit from Targeted Ads. Send these audiences to Google Ads to execute highly targeted campaigns. Displaying ads to users interested in specific products increases clicks and drives interested traffic. Personalization: Display various website content or promotions to multiple groups of users (you may need other tools, but GA4 provides the data).
Finding New Customers: Use ad platforms to find new users who resemble your top-performing audience segments.
Growing Sales (Indirect Traffic Support):
What it does: GA4’s “Conversions” reporting and “Funnel Exploration” functionality enable you to track critical activities (e.g., sign-ups or buys). You can see users’ journey steps and where they drop off or fall away.
How it builds traffic: Making existing visitors do something is more involved in improving sales than assisting traffic directly. An improving sales page usually has a good user experience. Fixing problems where people leave reduces usability complexity. In addition, when your sales numbers are substantial, your current traffic is worth more. This enables it to be easier to pay more to attract new traffic.
Using Predictions:
What it does: When you have enough data, GA4 can infer which users will most likely buy in the coming period or which will likely stop visiting. It can create “Predictive Audiences” based on these inferences.
How it increases traffic: Attract potential buyers likely to purchase with exclusive offers using Google Ads. This makes them return to your site to complete the purchase. We often see that engaged users are likely to leave with exclusive messages or offers to maintain their interest. This prevents you from losing existing traffic.
By using these abilities, you move from guessing to knowing. You know your users, origin, preferences, and why they purchase or drop off. Acting on such insights is the key to gaining actual traffic growth.
How Can You Get Started with Google Analytics 4
Setting up GA4 is the starting point towards maximizing its power. Below is an easy-to-follow guide:
Do You Already Have Analytics?
If Yes (Universal Analytics): Google asked people to switch. You might already have an easy GA4 setup through UA’s GA4 Setup Assistant.
Take a look at your Google Analytics 4 account under ‘Admin’. Look for that property ID, which starts with “G-” instead of “UA-“. If yours starts with a G, you are fine to work with your account.
One key thing you should note is that UA stopped showing new data in mid-2023 (or mid-2024 for paid plans), so you must use GA4 now.
If No, You Can Start Fresh with Google Analytics 4
Set up a Google Analytics Account and Google Analytics 4 Property:
The first step is to go to the official Google Analytics website. Log in to your Google account. Click “Start measuring.” Set up an Account (like Your Business Name). Set up a Property (like Your Website Name). Choose your time zone and currency type.
Note: GA4 uses ‘Data Streams’ instead of UA’s ‘Views’.
Set Up a Data Stream:
After creating the property, set up a data stream (where your data comes from). Choose the platform: “Web,” “Android app,” or “iOS app.” Enter your URL (like https://www.yourwebsite.com) for a website and name the stream. Make sure “Enhanced measurement” is on. This automatically tracks everyday actions like page views, scrolls, clicks, site searches, video views, and file downloads. It saves a lot of setup time! Click “Create stream.”
Install the Google Analytics 4 Tracking Tag:
When you set up the stream, you will see “Installation instructions.” You need to add code (the Google tag) to your website.
Options:
- Website Builder/CMS Plugin: WordPress, Shopify, Wix, and others often have an easy way of inserting GA4.
- Go to settings, look for the Google Analytics section, and paste your Measurement ID (which shows as G-XXXXXXXXXX).
- Google Tag Manager (Recommended): Most flexible option. In GTM, create a “Google Analytics 4 Configuration” tag, enter your Measurement ID, and set it to fire on all pages.
- Publish updates. Install Manually: Paste and copy the Google tag code (gtag.js) and place it in the < head> of every page on your site. This calls for some technical skill.
Test If It’s Working:
After you’ve applied the tag, inspect your site. In Google Analytics 4, go to the “Realtime” report. Your visit will appear instantly if it’s set up.
Basic Settings (in GA4 Admin):
Data Retention: Admin > Settings > Data Retention. Change the setting from 2 to “14 months” to save detailed user data for extended analysis.
Google Signals: Admin > Data Settings > Data Collection. Consider allowing Google Signals for information about gender, age, cross-device, and remarketing audiences.
Update your privacy policy if you do allow this. Create Conversions: Admin > Conversions. GA4 might tag a purchase as a conversion automatically. Take a look at other actions (like form_submit or sign_up). Activate “Mark as conversion” on actions that are essential goals on your site.
How Can You Generate Google Analytics 4 Reports? How to Use Them?
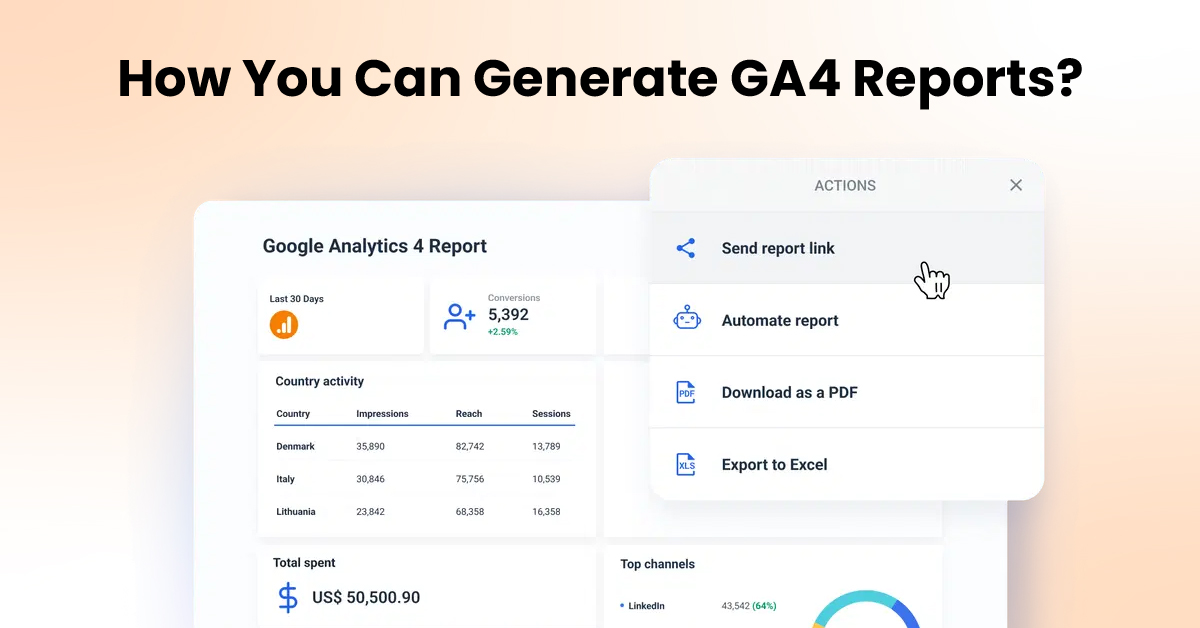
GA4 looks different from UA but has great reports once you have discovered how to create them. Find reports in the left menu under “Reports” and “Explore.”
Standard Reports (“Reports” Section):
Below is the table for pre-written summaries for regular checks.
| Reports | Result |
| Realtime | See what’s going on at the moment, which is good for testing. |
| Acquisition | Shows where users are coming from. |
| Traffic acquisition | Shows the source (Search, Social, Direct, etc.) of visits. |
| Engagement | Critical for understanding how well each source is performing. Check Users, Engagement Rate, and Conversions by source. |
| Conversions | Highlights your most important goal completions. |
| Pages and screens | Indicates your most viewed and engaging content. Critical for content planning. |
| Monetization | (For e-commerce websites) Revenue, product reports. |
| Retention | Indicates users come back in the long term. |
| Demographics | User information (location, gender, age) when Google Signals is turned on. |
Explorations (“Explore” Tab):
This is where GA4’s real potential for custom analysis resides. Build reports are not available in the default tab.
Key Types:
- Free Form: Drag and drop dimensions (such as Page) and metrics (such as Users) to create custom tables and charts.
- Funnel Exploration: See the steps users follow towards a goal (such as purchase) and where they fall off. Assists in improving sales.
- Path Exploration: See the order of pages visited or actions taken by users. Assists in mapping user journeys.
Building an Example Report (Traffic Acquisition):
Go to Reports > Acquisition > Traffic acquisition. Look at the table of traffic sources (e.g., Google Search, Direct). Examine numbers like Users, Engagement rate, and Conversions. Insight Example: If Google Search sends many users who don’t engage much compared to Email traffic, you might have to optimize the landing pages of your search visitors or focus more on email.
Building an Example Exploration (Simple Funnel):
Go to Explore > Create a new “Funnel exploration.” Set Steps based on action names (e.g., Step 1: session_start, Step 2: view_item, Step 3: add_to_cart, Step 4: purchase). GA4 shows how many users complete each step and how many drop off.
Insight Example: If many users drop off between adding to the cart and buying, check your checkout process for problems (e.g., high shipping charges or complicated forms).
Reporting is but one step. The payoff is meaning-making – asking “Why?” and “What do I do?” Read significant reports consistently and use Explanations to explore specific questions.
Conclusion: Use Insights to Act
Google Analytics 4 is more than a way to track visitors; it’s your guide on the web. With its action-based tracking, cross-device reporting, and good reports, you will understand your audience well.
That insight is the basis for optimizing your traffic. Knowing something about what content works, which sites drive quality traffic, how your users are moving around your site, and where they are stuck enables you to target your efforts precisely.
One thing about Pro users is that they can appreciate how the insights can help guide the traffic. Knowing what content works, which sites drive quality traffic, how users move around your site, and where they are stuck. This kind of information is just priceless.
Articulating these compelling Google Analytics 4 insights into effective marketing campaigns is a skill that needs practice and experience. If you want to improve your ability to use data for expansion quickly, consider looking over pre-structured learning resources. For example, ValueX2 offers expert courses like their ICAgile Agility in Marketing Training with ICP-MKG Certification, which is designed to help one learn data-driven agile marketing techniques and how to execute them successfully.
Frequently Asked Questions (FAQs) about Google Analytics 4
What is the most significant difference between GA4 and Universal Analytics (UA)?
GA4 uses action-based tracking (tracking what people do) instead of UA’s visit-based tracking (tracking website visits). This gives a more accurate view of user behaviour across devices. UA no longer shows new data.
Is Google Analytics 4 free of charge?
Yes, the basic GA4 setup is free of charge. A paid version (Analytics 360) exists for huge organizations.
Do I still need to use Universal Analytics (UA)?
No. UA stopped showing new data in 2023/2024. All current tracking needs GA4. You may be able to see historical UA reports temporarily, but you cannot track any new data there.
For how long does GA4 keep in-depth user data?
2 months by default. You can modify it in Admin settings to 14 months. General data, like overall page views, is kept longer.
What is an “event” in GA4?
An event is any user action you measure, like viewing a page, clicking, scrolling, completing a form, or purchasing.
Can GA4 measure both web and app users in the exact location?
Yes. To see aggregated data, you set up individual ‘data streams’ for web, iOS, and Android within the same GA4 property.
What is Google Signals, and do I need to enable it?
It collects data from signed-in Google accounts (if they allow ads to be personalized). Enabling it gives you data on age and gender, helps to track users across devices, and lets you create lists for showing ads again. Don’t forget to refresh your privacy policy if you use it.
Where is the Bounce Rate in GA4?
GA4 uses ‘Engagement Rate’ instead. An ‘Engaged Session’ is a session of over 10 seconds containing a conversion or which views two or more pages. A low Engagement Rate means people aren’t engaged, just like a high UA Bounce Rate.

Bhavna is an Agile Coach and Consultant with over a decade of experience in advisory, corporate finance, IT assurance, and operations at Big 4 and within the industry in the UK and India. She has recently been the CEO of a start-up where she implemented agile practices within HR, Marketing, and Product teams.
She is also a SAFe® Practice Consultant (SPC) and authorized instructor for ICAgile Agility in HR (ICP-AHR), Agility in Marketing (ICP-MKG), and Business Agility Foundations (ICP – BAF) training courses. She provides training for agile transformation to corporate, public, and private batches, as well as consulting for enterprise agile transformation.


